Learning Center
Learn more about how trading works and how WiXy.ai is working.
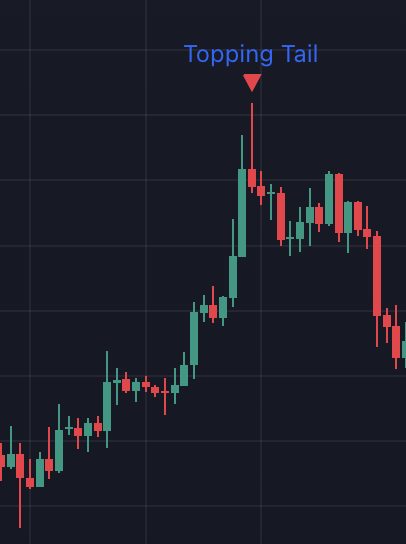
Topping Tail
A Topping Tail (or upper shadow) appears when price moves sharply upward but gets rejected, closing near the session’s low. This pattern signals potential weakness or a reversal to the downside—especially after a strong rally. It reflects seller dominance late in the session.
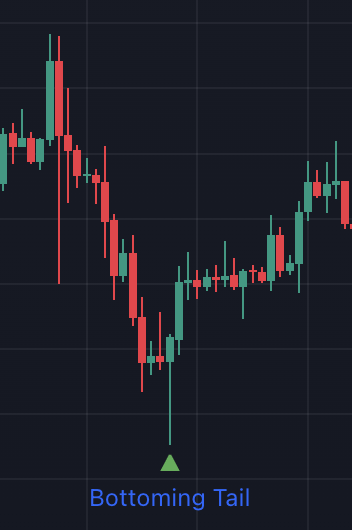
Bottoming Tail
A Bottoming Tail often suggests buying pressure and possible upside reversal, especially when seen after a downtrend.
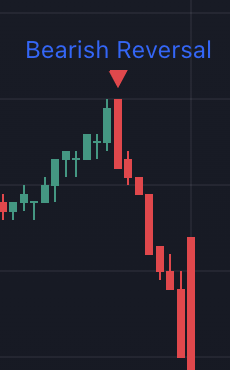
Bearish Engulfing Reversal
A Bearish Engulfing reveals strong selling pressure and can be a warning of a trend reversal to the downside.
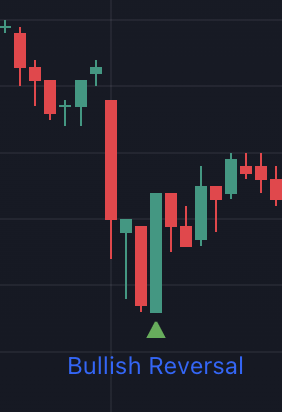
Bullish Engulfing Reversal
A Bullish Engulfing Reversalsignals a shift in momentum from sellers to buyers and often marks the start of a new upward move.
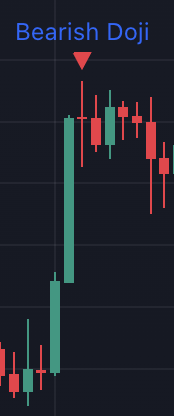
Bearish Doji
A Bearish Doji appears when a candle has a small or non-existent body, with shadows on both sides.
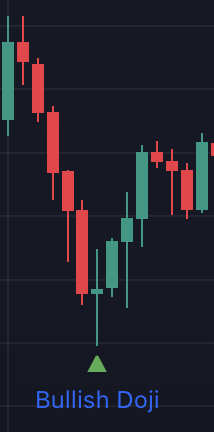
Bullish Doji
A Bullish Doji appears when a candle has a small or non-existent body, with shadows on both sides
Mastering the RSI
The Relative Strength Index (RSI) is one of the most widely used technical indicators in trading—and. Simple yet powerful, the RSI helps traders measure market momentum and identify potential overbought or oversold conditions. Whether you're trading stocks, forex, or crypto.
The VWAP Explained
In technical trading, few tools offer as much insight into market value as the VWAP, or Volume Weighted Average Price. It’s a favorite among institutional traders and a powerful guide for day traders alike. But what exactly is VWAP, and how can it improve your trading strategy?
Moving Average?
When entering the world of trading or investing, one of the first and most valuable tools you’ll come across is the Moving Average. It’s simple, yet powerful — helping traders spot trends.
MACD: A Powerful Indicator for Trend and Momentum
One of the most trusted tools is the MACD, short for Moving Average Convergence Divergence. Understanding how to apply the MACD can help stay ahead of market shifts.
Double Top Pattern
When it comes to recognizing trend reversals in trading, few patterns are as iconic—or as useful—as the Double Top. It’s a classic chart formation that can signal the end of a bullish trend and the beginning of a potential downtrend.
Double Bottom Pattern
Price patterns are powerful tools that help traders anticipate market movements. One of the most well-known reversal patterns is the Double Bottom. Recognizing this formation can help you spot bullish opportunities.
Head and Shoulders Pattern
In technical analysis, chart patterns are like a language the market speaks. One of the most reliable and widely recognized of these is the Head and Shoulders pattern — a formation that can give traders an early warning of a trend reversal. Whether you're new to trading or looking to sharpen your strategy, understanding this pattern can offer a serious edge.
Inverse Head and Shoulders Pattern
In technical analysis, chart patterns often tell a deeper story about market psychology. One of the most reliable and well-known bullish reversal patterns is the Inverse Head and Shoulders. Spotting this pattern early can give traders a significant edge—allowing them to prepare for a potential trend shift before it happens.
Rising Wedge Pattern
In technical analysis, chart patterns can serve as early warnings of potential market movements. One such pattern is the Rising Wedge, a formation that may look bullish at first glance—but often hides a bearish twist.
Falling Wedge Pattern
Recognizing patterns can give you a powerful edge. One such pattern that often signals a shift in momentum is the Falling Wedge. While it may look bearish at first glance, this pattern often hides a bullish message.
Bull Flag Pattern
In technical analysis, patterns tell stories. One of the most well-known and reliable bullish continuation patterns is the Bull Flag. Recognized for its clean structure and strong momentum, this pattern offers traders a clear opportunity to join an existing trend.
Bear Flag Pattern
In technical analysis, chart patterns help traders recognize high-probability setups in the market. One of the most reliable continuation patterns during a downtrend is the Bear Flag. Recognizing this pattern early can help traders position themselves before the next move unfolds.
Bullish Pennant Pattern
In the fast-moving world of trading, recognizing continuation patterns can help you stay on the right side of the trend. The Bullish Pennant — a formation that often signals that a strong upward move is just catching its breath before continuing higher.
Ascending Triangle Pattern
In technical analysis, chart patterns offer powerful insight into market psychology. One of the most reliable and widely recognized patterns is the Ascending Triangle.
Descending Triangle Pattern
This formation can provide traders with early signals of a possible breakdown and a chance to prepare or capitalize on market movement.
Bullish Rectangle Pattern
In technical analysis, recognizing chart patterns can give traders a strategic edge. One such pattern that often signals opportunity is the Bullish Rectangle Pattern.
Bearish Rectangle Pattern
Recognizing chart patterns is a valuable way to understand market psychology and price action. One such pattern that signals a possible continuation of a downtrend is the Bearish Rectangle Pattern.