Head and Shoulders
In technical analysis, chart patterns are like a language the market speaks. One of the most reliable and widely recognized is the Head and Shoulders pattern — a formation that can give traders an early warning of a trend reversal. Whether you're new to trading or looking to sharpen your strategy, understanding this pattern can offer a serious edge.
- What Is the Head and Shoulders Pattern?
- Structure
- The Neckline
- The Psychology Behind the Pattern
- The Inverse Head and Shoulders
- How Traders Use It
- Limitations to Keep in Mind
- Final Thoughts
What Is the Head and Shoulders Pattern?
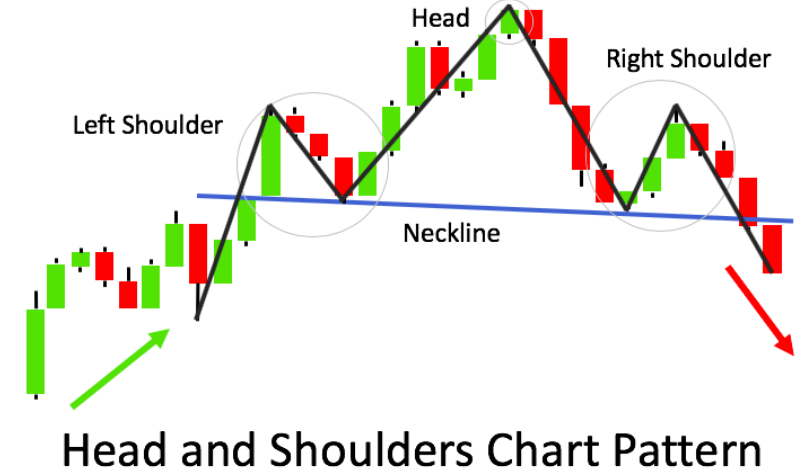
The Head and Shoulders pattern is a bearish reversal formation that typically signals the end of an uptrend and the potential beginning of a downtrend. Visually, it resembles a human head with two shoulders on either side.
Structure
It consists of three peaks:
- Left shoulder: A price high, followed by a small decline.
- Head: A higher peak, followed by another decline.
- Right shoulder: A lower high that is roughly equal to the left shoulder.
The Neckline
Connecting the low points between the shoulders and the head forms the neckline. This neckline acts as a key support level. When the price breaks below this neckline, the pattern is considered complete — and a reversal is likely underway.
Head and Shoulders are used by the WiXy AI algorithm. It is one of the indicators used to determine if WiXy.ai should look for a Bearish signal.
The Psychology Behind the Pattern
Each part of the pattern represents a shift in market sentiment:
- Left shoulder: Buying strength appears, but meets resistance.
- Head: Optimism peaks yet shows signs of exhaustion.
- Right shoulder: Bullish momentum weakens.
- Break below neckline: Sellers take control and confirm reversal risk.
The Inverse Head and Shoulders
There’s also a bullish version — the Inverse Head and Shoulders. It appears during a downtrend and signals a possible reversal to the upside. It’s essentially the mirror image of the traditional pattern, with the “head” and “shoulders” forming as lows instead of highs.
How Traders Use It
- Draw the neckline across the two lows between the shoulders.
- Wait for a break below the neckline to confirm the pattern.
- Enter a short position on the break, or after a retest of the neckline.
- Set a target by measuring the distance from the top of the head to the neckline and projecting it downward from the breakout point.
- Use stop-loss orders above the right shoulder to manage risk.
Limitations to Keep in Mind
No pattern is foolproof. The Head and Shoulders can sometimes fail or retest the neckline before continuing the new trend. That’s why confirmation and volume analysis are crucial. Look for increased volume on the breakout, which often adds strength to the signal.
Final Thoughts
The Head and Shoulders pattern is a classic for a reason — it's a strong indicator of trend exhaustion and a potential shift in direction. By learning to spot this formation and combining it with proper risk management and confirmation tools, you'll be better prepared to anticipate market moves and act with confidence.
Keep practicing, stay observant, and remember: patterns don’t predict the future — they give you insight into the psychology behind the price. Use that insight wisely, and you’re already ahead.
Create a Free Account at WiXy.ai and begin your adventure in the Crypto Space.
Learn more from these articles
A Track Record of Winning.
WiXy.ai delivers. Built on data.
Proven by results. Backtested, battle tested and ready for you.