Mastering the Double Bottom Pattern: A Classic Reversal Signal
In technical analysis, price patterns are powerful tools that help traders anticipate market movements. One of the most reliable and well-known reversal patterns is the Double Bottom. Recognizing this formation can help you spot bullish opportunities just as a downtrend is losing steam.
- What Is a Double Bottom Pattern?
- Key Characteristics
- What Does It Mean?
- How to Trade a Double Bottom
- Final Thoughts

What Is a Double Bottom Pattern?
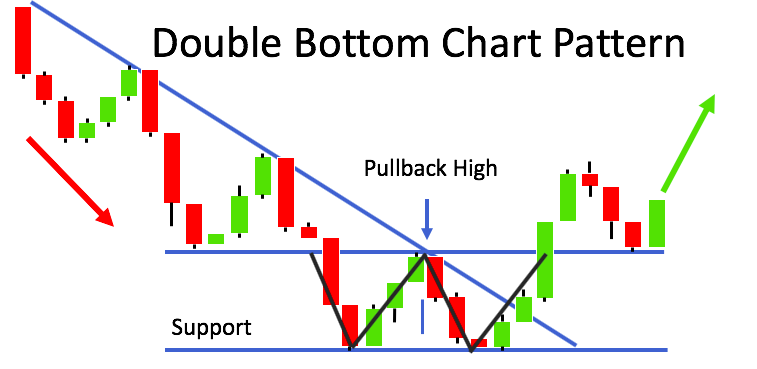
The Double Bottom is a bullish reversal pattern that occurs after a sustained downtrend. It consists of two distinct troughs (or "bottoms") that form at roughly the same price level, separated by a temporary price rally. Visually, it resembles the letter “W”.
This pattern suggests that the market has found a strong support level, where buyers are stepping in twice to prevent the price from falling further.
Key Characteristics
- Downtrend Preceding the Pattern: Only meaningful when it follows a clear and sustained downtrend.
- First Bottom: Price hits a low, then rebounds slightly in a short-term relief rally.
- Second Bottom: Price retests the previous low but fails to break it — a sign of weakening selling pressure.
- Neckline (Resistance Level): The high between the two bottoms creates a neckline. A breakout above it confirms the pattern.
- Volume: Volume often increases during the breakout, strengthening the reversal signal.
What Does It Mean?
The Double Bottom pattern signals a potential shift from a bearish to a bullish trend. The market tests a support level twice without breaking lower, indicating sellers are losing control. When price breaks above the neckline, it marks a shift in momentum toward buyers.
This pattern often leads to a strong upward move, especially when supported by volume or other indicators.
How to Trade a Double Bottom
Wait for Confirmation
Don’t enter a trade just because you see two lows — wait for a confirmed breakout above the neckline.
Entry Point
Many traders enter a long position just above the neckline after confirmation.
Stop Loss
A common stop-loss is placed just below the second bottom to limit risk in case the pattern fails.
Profit Target
Measure the distance between the bottoms and the neckline, then project that distance upward from the breakout to determine your profit target.
Final Thoughts
The Double Bottom is a powerful signal of trend reversal, especially when supported by volume and a well-defined price structure. It serves as a reminder that patience and confirmation are key—don’t jump in too early.
By mastering this classic pattern, you can spot market turnarounds with greater confidence and clarity.
Create a Free Account at WiXy.ai and begin your adventure in the Crypto Space.
Learn more from these articles
A Track Record of Winning.
WiXy.ai delivers. Built on data.
Proven by results. Backtested, battle tested and ready for you.