Bear Flag
In technical analysis, chart patterns help traders recognize high-probability setups in the market. One of the most reliable continuation patterns during a downtrend is the Bear Flag. Recognizing this pattern early can help traders position themselves before the next move unfolds.
- What Is a Bear Flag Pattern?
- What Does It Mean?
- Key Characteristics of a Bear Flag
- How to Trade the Bear Flag
- Example in Action
- Final Thoughts
What Is a Bear Flag Pattern?
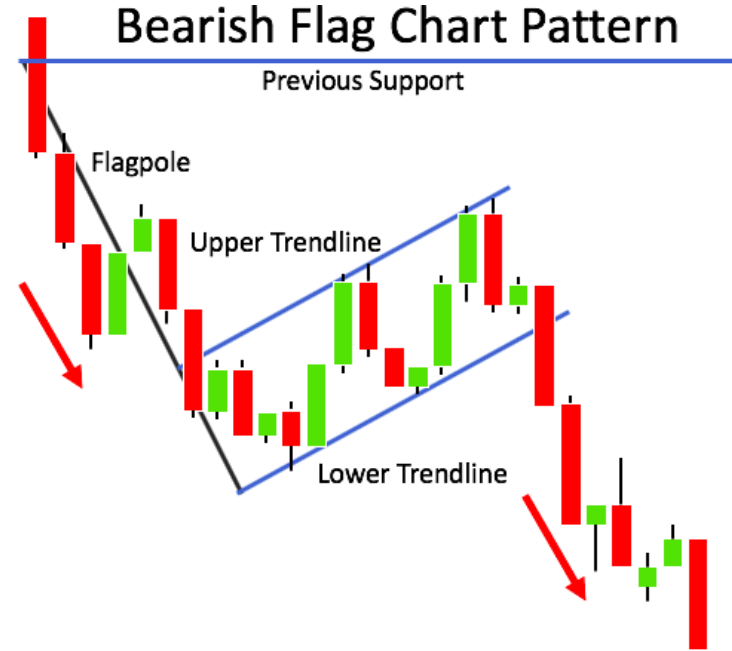
A Bear Flag is a continuation pattern that appears during a downtrend. It reflects a temporary pause or consolidation before the price continues to move lower.
The pattern consists of two parts:
- The Flagpole: A sharp and strong downward move, showing heavy selling pressure.
- The Flag: A short period of consolidation where the price moves slightly upward or sideways in a small channel — often resembling a rising flag.
Visually, it looks like a flag flying on a pole — but pointing upward during a downtrend.
Bear Flag are used by the WiXy AI algorithm. It is one of the indicators used to determine if WiXy.ai should look for a Bearish signal.
What Does It Mean?
The Bear Flag tells us that sellers are in control, but after a big drop, the market takes a short “breather.” During this pause, some traders may take profits, and others might enter late long positions, causing a slight upward pullback.
However, this rally is usually weak and short-lived. Once the pattern is complete, sellers return and push the price even lower, continuing the downtrend.
Key Characteristics of a Bear Flag
To confirm a Bear Flag, look for:
- A steep drop in price (the flagpole).
- A tight, upward-sloping channel (the flag).
- Declining volume during the flag formation.
- A breakdown below the lower boundary of the flag, often accompanied by rising volume.
This breakdown signals a possible entry for a short trade.
How to Trade the Bear Flag
Here’s a basic strategy for trading this pattern:
- Identify the flagpole: Look for a strong downward move.
- Wait for the flag to form: A brief upward or sideways consolidation.
- Set your entry: Consider entering short when the price breaks below the lower trendline of the flag.
- Manage risk: Place a stop-loss above the upper trendline of the flag.
- Set a target: A common method is to project the length of the flagpole downward from the breakout point.
Example in Action
Imagine a stock falls sharply from $50 to $40 — this is your flagpole. Then it bounces back up to $43 in a tight channel. If it breaks down below $42 with strong volume, the next move could take it to around $33, based on the flagpole height.
Final Thoughts
The Bear Flag pattern is a powerful tool for traders who want to ride the trend instead of fighting it. It’s not about predicting the market — it's about reading its signals and reacting with discipline. When used alongside volume, support/resistance levels, and proper risk management, the Bear Flag can become a valuable weapon in your trading strategy.
Keep learning, keep practicing — and soon, spotting patterns like these will feel second nature.
Create a Free Account at WiXy.ai and begin your adventure in the Crypto Space.
Learn more from these articles
A Track Record of Winning.
WiXy.ai delivers. Built on data.
Proven by results. Backtested, battle tested and ready for you.