Ascending Triangle
In technical analysis, chart patterns offer powerful insight into market psychology. One of the most reliable and widely recognized patterns is the Ascending Triangle. Whether you're a beginner or a seasoned trader, learning to spot this pattern can sharpen your edge in spotting potential breakouts.
- What Is an Ascending Triangle?
- What Does It Tell Us?
- Key Characteristics
- How to Trade It
- Example Scenario
- Why It Matters
- Final Thoughts
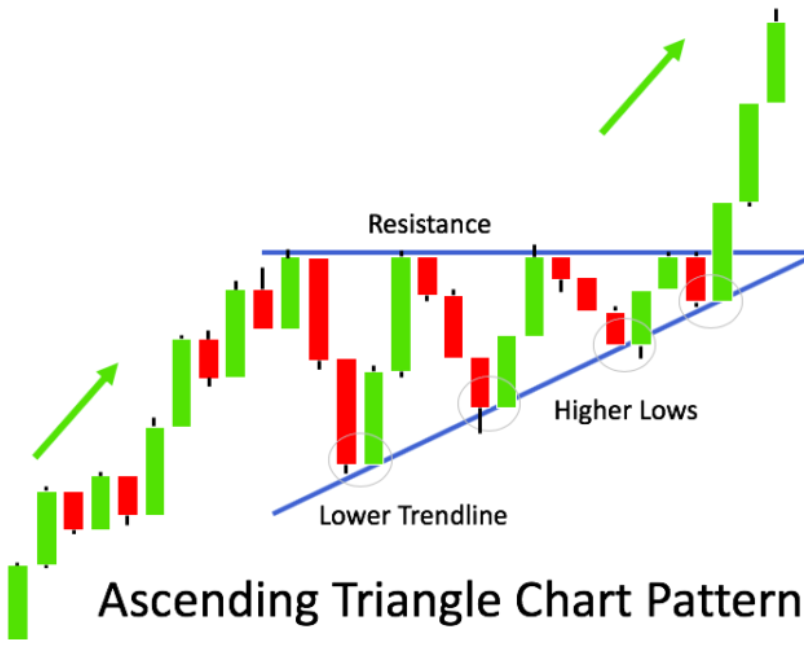
What Is an Ascending Triangle?
An Ascending Triangle is a bullish continuation pattern that typically forms during an uptrend. It’s created by drawing two lines:
- Horizontal Resistance: A line at the top, where the price repeatedly fails to break through.
- Ascending Support: A rising line at the bottom, showing higher lows over time.
Visually, it forms a triangle that "leans upward," hence the name.
Ascending Triangle are used by the WiXy AI algorithm. It is one of the indicators used to determine if WiXy.ai should look for a Bullish signal.
What Does It Tell Us?
The pattern reflects increasing buying pressure. Each time sellers push the price down from the resistance level, buyers return more aggressively, creating higher lows. This tug-of-war builds tension. Eventually, the pressure becomes too strong, and the price breaks through the resistance, often followed by a sharp upward move.
Key Characteristics
- Trend: Usually occurs in an existing uptrend, but can sometimes signal a reversal if it appears at the bottom of a downtrend.
- Volume: Tends to decrease during the formation of the triangle, then spikes on the breakout.
- Breakout Direction: Typically upwards, through the resistance line.
How to Trade an Ascending Triangle
- Identify the Pattern: Look for at least two equal highs (resistance) and two rising lows (support).
- Wait for the Breakout: A confirmed breakout occurs when the price closes above the resistance line, ideally with increased volume.
- Set Targets: Measure the height of the triangle and project it upward from the breakout point to estimate a price target.
- Manage Risk: Place a stop-loss just below the last higher low or below the triangle’s support line.
Example Scenario
Let’s say a stock keeps hitting resistance at $50, while its lows rise from $45 to $47 to $48. This forms an ascending triangle. If the price breaks above $50 with strong volume, traders may enter long positions with a target around $53–$55, depending on the triangle's height.
Why It Matters
The Ascending Triangle isn’t just a shape — it represents a battle between buyers and sellers. Each higher low shows increasing optimism. Recognizing this pattern early gives you the opportunity to plan your trades before the crowd reacts.
Final Thoughts
The Ascending Triangle is a go-to pattern for traders who want to ride the momentum of bullish breakouts. While no pattern is foolproof, this one offers a clear structure, easy-to-spot signals, and strong potential when confirmed. Mastering it means adding a valuable tool to your trading strategy — one that helps you move with confidence and foresight.
Create a Free Account at WiXy.ai and begin your adventure in the Crypto Space.
Learn more from these articles
A Track Record of Winning.
WiXy.ai delivers. Built on data.
Proven by results. Backtested, battle tested and ready for you.