Bullish Pennant
In the fast-moving world of trading, recognizing continuation patterns can help you stay on the right side of the trend. One of the most powerful of these patterns is the Bullish Pennant — a formation that often signals that a strong upward move is just catching its breath before continuing higher.
- What Is a Bullish Pennant?
- What Does It Mean?
- Key Characteristics of a Bullish Pennant
- How to Trade It
- Example
- Final Thoughts
What Is a Bullish Pennant?
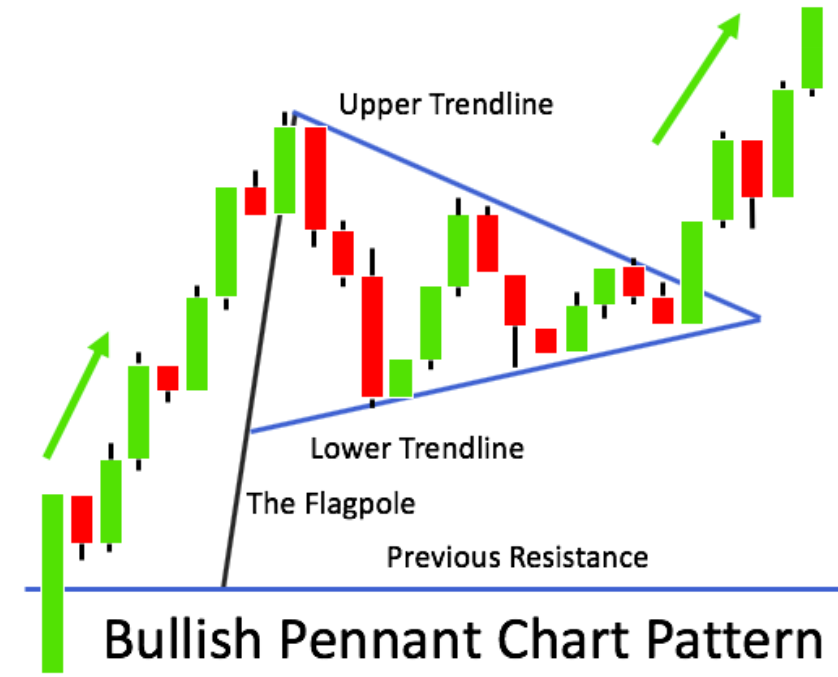
The Bullish Pennant is a continuation pattern that forms after a sharp price increase, known as the flagpole. After this strong move, the price consolidates in a small, symmetrical triangle — the pennant — before eventually breaking out in the same direction as the initial move: upward.
Visually, it looks like this:
- Flagpole: A strong, nearly vertical rise in price with high volume.
- Pennant: A brief consolidation where price moves in a narrowing range (like a small triangle).
- Breakout: A surge upward through the pennant’s resistance line, often with strong volume again.
Bullish Pennant are used by the WiXy AI algorithm. It is one of the indicators used to determine if WiXy.ai should look for a Bullish signal.
What Does It Mean?
The Bullish Pennant reflects a temporary pause in a strong uptrend. During the pennant phase, buyers and sellers are in a brief tug-of-war. But this is typically just a moment of rest — like a spring being compressed. When enough pressure builds, the price often explodes upward, continuing the prior momentum.
This makes it a favorite pattern for momentum traders and trend followers.
Key Characteristics of a Bullish Pennant
- Appears after a strong upward move (the flagpole).
- Short duration: usually lasts between 1–3 weeks on daily charts.
- Volume is high during the flagpole, and declines during consolidation.
- Breakout occurs with increased volume.
How to Trade It
Here’s a simple trading approach:
- Identify the pattern: Look for a strong move up, followed by a tight triangular consolidation.
- Set your entry: Place a buy stop order just above the pennant’s resistance line.
- Set your stop-loss: Place it just below the lower support of the pennant.
- Target: Measure the height of the flagpole and project it upward from the breakout point. This gives you a price target.
Example
If a stock moves from $50 to $60 during the flagpole, and then consolidates between $58–$60, the potential breakout target could be $70 ($60 + $10).
Final Thoughts
The Bullish Pennant is more than just a visual pattern — it’s a story of strength, where the market pauses before launching higher. With discipline and confirmation (like volume on breakout), this pattern can offer high-probability setups in trending markets.
Stay patient, stay alert, and when you spot a Bullish Pennant — be ready. It might just be the calm before the storm… in your favor.
Create a Free Account at WiXy.ai and begin your adventure in the Crypto Space.
Learn more from these articles
A Track Record of Winning.
WiXy.ai delivers. Built on data.
Proven by results. Backtested, battle tested and ready for you.