What Is a Double Top Pattern? A Guide to Spotting Reversals in the Market
When it comes to recognizing trend reversals in trading, few patterns are as iconic—or as useful—as the Double Top. It’s a classic chart formation that can signal the end of a bullish trend and the beginning of a potential downtrend. Whether you're new to trading or looking to sharpen your skills, understanding the Double Top pattern is a must.
- What Is a Double Top?
- Anatomy of the Pattern
- What Does It Mean?
- Why It Matters
- Confirmation Is Key
- Real-Life Example
- Final Thoughts
What Is a Double Top?
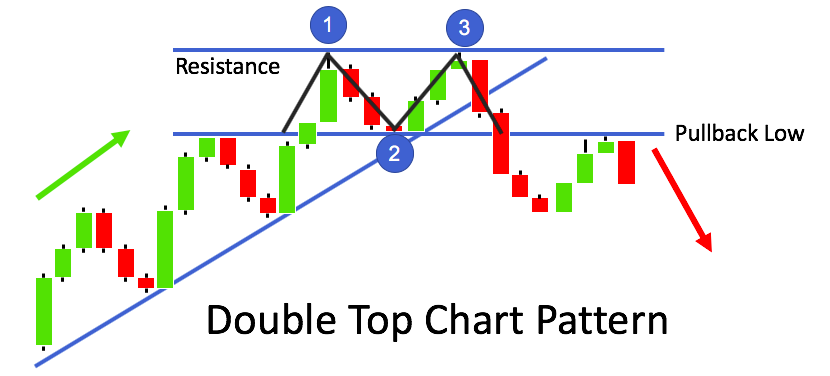
A Double Top is a bearish reversal pattern that forms after an extended uptrend. It appears when the price reaches a high point (the first top), pulls back, and then rises again to form a second peak at roughly the same level—but fails to break through. After the second peak, the price typically falls below the “neckline”, confirming the pattern.
Visually, the Double Top looks like the letter “M”.
Anatomy of the Pattern
Here’s what you’ll typically see in a Double Top:
- First Top: Price climbs to a high, then retraces
- Pullback: Price falls to a support level, forming the neckline
- Second Top: Price rises again but fails to break the previous high
- Breakdown: Price falls below the neckline, confirming the reversal
What Does It Mean?
The Double Top pattern indicates that buying momentum is weakening. After the first peak, buyers lose steam. When the second attempt to break the high also fails, it shows that sellers are gaining strength. Once the neckline is broken, it often triggers a wave of selling, confirming a trend reversal.
Why It Matters
The Double Top is important because it:
- Helps identify potential exits for long trades
- Can signal short-selling opportunities
- Gives insight into market psychology—where buyers are exhausted and sellers take over
Confirmation Is Key
Many traders wait for confirmation before acting on a Double Top. That means:
- A clear break below the neckline
- Possibly increased volume on the breakdown
- Additional tools like RSI or MACD showing bearish divergence
Without confirmation, a Double Top can be a false signal—just a consolidation before the trend continues.
Real-Life Example
Imagine a stock rising steadily and hitting $100 (first top), pulling back to $95 (neckline), then rising again to $100 (second top). If it fails again and breaks below $95, that’s your potential sell signal.
Final Thoughts
The Double Top is more than just a shape on a chart—it’s a sign of shifting power between buyers and sellers. By learning to recognize this pattern, you can anticipate reversals and make smarter trading decisions.
Stay sharp, stay patient, and let the market show you its next move.
Create a Free Account at WiXy.ai and begin your adventure in the Crypto Space.
Learn more from these articles
A Track Record of Winning.
WiXy.ai delivers. Built on data.
Proven by results. Backtested, battle tested and ready for you.