Bearish Rectangle
In technical analysis, recognizing chart patterns is a valuable way to understand market psychology and price action. One such pattern that signals a possible continuation of a downtrend is the Bearish Rectangle Pattern. When used correctly, it can help traders time entries and manage risk more effectively.
- What Is the Bearish Rectangle Pattern?
- How Does It Form?
- What Does It Tell Traders?
- How to Trade the Bearish Rectangle
- Example
- Final Thoughts
What Is the Bearish Rectangle Pattern?
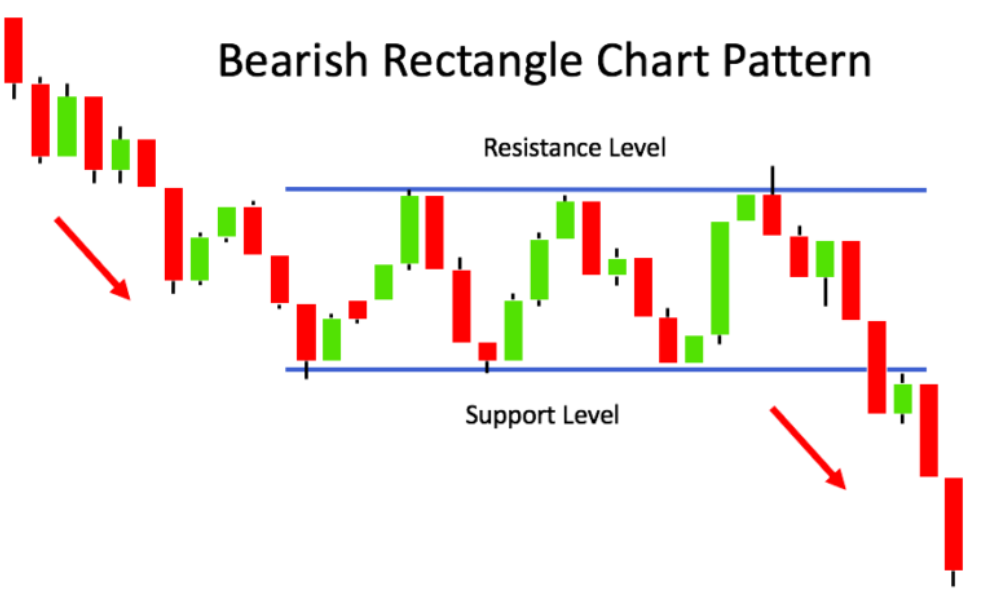
The Bearish Rectangle is a continuation pattern that forms during a downtrend. It represents a period of consolidation, where price moves sideways between two horizontal levels — resistance at the top and support at the bottom — before eventually breaking down and continuing the original bearish trend.
Visually, it looks like a rectangle drawn between parallel support and resistance lines.
Bearish Rectangle are used by the WiXy AI algorithm. It is one of the indicators used to determine if WiXy.ai should look for a Bearish signal.
How Does It Form?
- The price is already in a downtrend.
- It temporarily pauses and starts moving in a range.
- The price bounces between a defined support and resistance zone.
- Eventually, selling pressure builds, and the price breaks below the support line, continuing the downward trend.
This period of indecision is often seen as the market “catching its breath” before resuming the decline.
What Does It Tell Traders?
The Bearish Rectangle shows that, despite short-term balance between buyers and sellers, bears remain in control. The inability of bulls to push the price above resistance repeatedly is a sign of weak buying interest. Once the support breaks, it often leads to a strong move downward, driven by renewed selling momentum and possibly stop-loss orders being triggered.
How to Trade the Bearish Rectangle
To use this pattern effectively:
- Identify the downtrend and the rectangle formation.
- Draw horizontal lines at support and resistance.
- Wait for a clear breakout below the support level, ideally with increased volume.
- Enter a short position after the breakout (some traders wait for a retest of broken support).
- Place a stop-loss just above the rectangle’s resistance level.
- Set a profit target based on the height of the rectangle (measured from resistance to support), projected downward from the breakout point.
Example
If the rectangle ranges from $50 (resistance) to $45 (support), the height is $5. Upon a breakdown below $45, a reasonable price target would be around $40.
Final Thoughts
The Bearish Rectangle Pattern is a reliable continuation
Create a Free Account at WiXy.ai and begin your adventure in the Crypto Space.
Learn more from these articles
A Track Record of Winning.
WiXy.ai delivers. Built on data.
Proven by results. Backtested, battle tested and ready for you.