Bull Flag
In technical analysis, patterns tell stories. One of the most well-known and reliable bullish continuation patterns is the Bull Flag. Recognized for its clean structure and strong momentum, this pattern offers traders a clear opportunity to join an existing trend.
- What Is a Bull Flag?
- What Does It Tell Us?
- How to Identify a Bull Flag
- How Traders Use the Bull Flag
- Example Scenario
- Final Thoughts
What Is a Bull Flag?
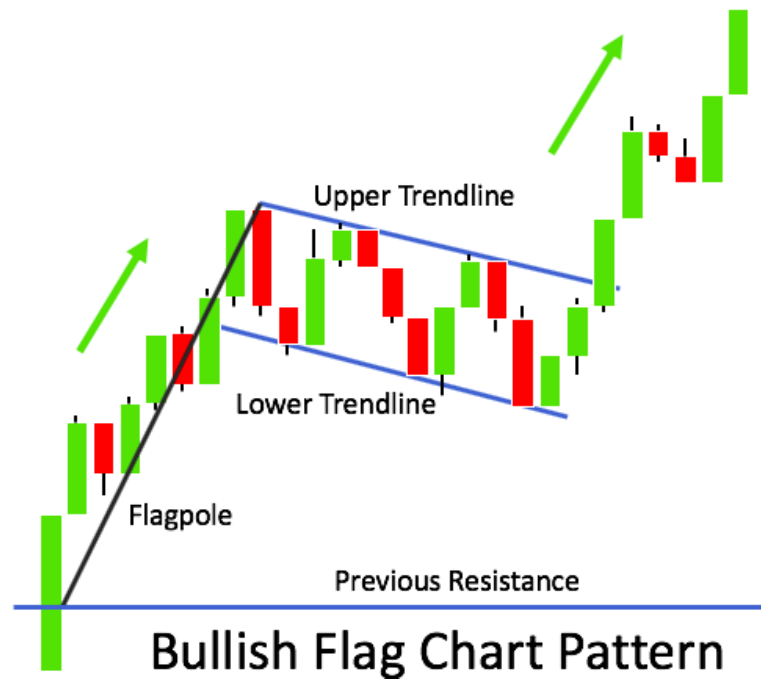
A Bull Flag is a price pattern that appears during an uptrend. It consists of two parts:
- The Flagpole: A sharp, strong upward move — usually driven by high volume and momentum.
- The Flag: A short-term, downward or sideways consolidation, forming a rectangular or slightly sloped channel.
The name comes from how it resembles a flag on a pole — a surge followed by a brief pause, as if the market is catching its breath.
Bull Flag are used by the WiXy AI algorithm. It is one of the indicators used to determine if WiXy.ai should look for a Bullish signal.
What Does It Tell Us?
The Bull Flag shows that buyers are in control, but after a strong push, the market takes a moment to consolidate. During this pause, sellers try to regain control, but fail to push the price down significantly. This “rest” period is often healthy and sets up the next leg higher.
When the price breaks out of the flag structure to the upside, it usually signals the continuation of the prior uptrend.
How to Identify a Bull Flag
To recognize a Bull Flag, look for:
- A strong upward price move (flagpole).
- A tight consolidation or pullback in the form of a downward or horizontal channel (flag).
- Decreasing volume during the flag, followed by a volume spike on the breakout.
- A breakout above the upper boundary of the flag, confirming the pattern.
How Traders Use the Bull Flag
The Bull Flag is a favorite among trend traders because it offers:
- Clear entry: When the price breaks above the flag's upper resistance line.
- Stop-loss placement: Below the flag's lower support line.
- Profit target: Often equal to the height of the flagpole, projected from the breakout point.
This pattern works well in trending markets — especially when supported by strong fundamentals or macro news.
Example Scenario
Let’s say a stock surges from $50 to $65 on high volume. Then it consolidates between $63 and $60 for a few days, forming the flag. If the stock breaks above $63 with strong volume, traders may enter long, expecting a continuation of the uptrend — possibly targeting $78 (flagpole of $15 added to $63).
Final Thoughts
The Bull Flag is more than just a pattern — it’s a story of momentum, pause, and continuation. When used with proper risk management and confirmation tools like volume or support levels, it can be a high-probability setup in your trading strategy.
Remember: patience is key. Let the pattern form fully and wait for the breakout before acting. Trading is a game of discipline — and the Bull Flag rewards those who play it smart.
Create a Free Account at WiXy.ai and begin your adventure in the Crypto Space.
Learn more from these articles
A Track Record of Winning.
WiXy.ai delivers. Built on data.
Proven by results. Backtested, battle tested and ready for you.