Descending Triangle
In technical analysis, chart patterns offer valuable insights into market psychology and potential price movement. One of the most reliable and well-known patterns is the Descending Triangle. This formation can provide traders with early signals of a possible breakdown and a chance to prepare or capitalize on market movement.
- What Is a Descending Triangle?
- What Does It Indicate?
- Key Characteristics
- How to Trade It
- Example
- Bullish Trap?
- Final Thoughts
What Is a Descending Triangle?
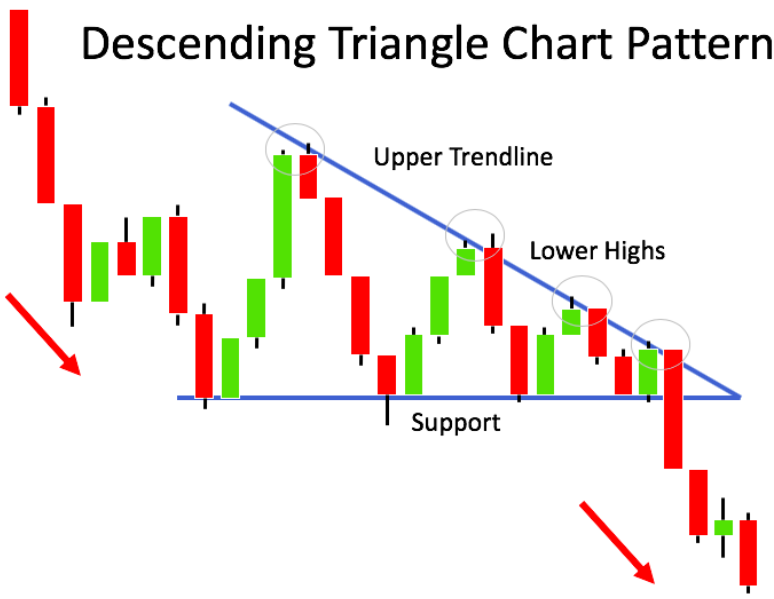
A Descending Triangle is a bearish chart pattern that forms when a price consolidates between a flat support level and a series of lower highs. Visually, it creates a triangle shape pointing downward — the support line runs horizontally, while the resistance line slopes down.
This pattern reflects a gradual shift in momentum, as buyers fail to push prices higher while sellers become increasingly aggressive.
Descending Triangle are used by the WiXy AI algorithm. It is one of the indicators used to determine if WiXy.ai should look for a Bearish signal.
What Does It Indicate?
The Descending Triangle is typically a continuation pattern in a downtrend. It suggests that selling pressure is building and that a breakdown below the support level is likely. However, in some cases, it may also appear after an uptrend and lead to a reversal.
When the price finally breaks below the horizontal support with strong volume, it often leads to accelerated selling.
Key Characteristics
- Support: A horizontal support level that the price touches multiple times.
- Lower Highs: A series of lower highs, indicating weakening bullish momentum.
- Tightening Range: A narrowing price range, forming a triangle.
- Volume: A volume drop during the formation, followed by a spike on the breakout.
How to Trade It
- Entry: Enter a short position after the price closes below support, confirmed by higher volume.
- Stop-Loss: Place it just above the most recent lower high inside the triangle.
- Target: Measure the height of the triangle at its widest part and subtract it from the breakout point — this gives a projected price target.
Example
If the triangle is $5 tall, and the breakdown happens at $50, the target could be around $45.
Bullish Trap? Watch Closely
Though Descending Triangles are bearish most of the time, occasionally a false breakout occurs, or price may even break to the upside if buyers regain control. That’s why volume confirmation and proper risk management are crucial.
Final Thoughts
The Descending Triangle is a classic and powerful pattern that reflects supply overwhelming demand. By learning to identify and trade it wisely, you gain a structured edge — allowing you to spot potential breakdowns before they fully unfold.
Stay patient, follow the pattern, and let the market come to you. Mastery comes not from chasing trades, but from recognizing them before they take shape.
Create a Free Account at WiXy.ai and begin your adventure in the Crypto Space.
Learn more from these articles
A Track Record of Winning.
WiXy.ai delivers. Built on data.
Proven by results. Backtested, battle tested and ready for you.