Rising Wedge
In technical analysis, chart patterns can serve as early warnings of potential market movements. One such pattern is the Rising Wedge, a formation that may look bullish at first glance — but often hides a bearish twist.
- What Is a Rising Wedge Pattern?
- What Does the Rising Wedge Tell Us?
- Key Characteristics of the Rising Wedge
- How to Trade the Rising Wedge
- Rising Wedge vs Falling Wedge
- Final Thoughts
What Is a Rising Wedge Pattern?
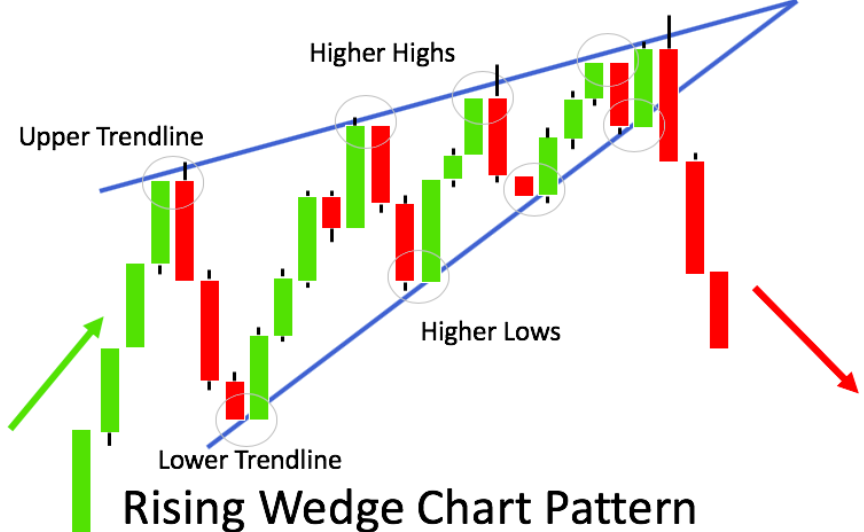
A Rising Wedge is a chart pattern formed when price action is moving upward, but the trendlines around the highs and lows are converging. In other words, both the support and resistance levels are sloping upwards — but the support line rises faster than the resistance line, causing the wedge to narrow.
This pattern can appear in both uptrends and downtrends, but it is typically seen as a bearish reversal pattern, especially when it forms after a strong upward move.
Rising Wedge are used by the WiXy AI algorithm. It is one of the indicators used to determine if WiXy.ai should look for a Bearish signal.
What Does the Rising Wedge Tell Us?
The Rising Wedge suggests that momentum is weakening. While prices are still climbing, the narrowing structure indicates that buyers are losing strength, and sellers are quietly gaining control. Volume often declines during the formation, reinforcing the idea of waning interest.
Eventually, the price breaks downward, often sharply, below the lower support line. This breakdown can trigger a wave of selling, making the Rising Wedge a powerful bearish signal.
Key Characteristics of the Rising Wedge
- Higher highs and higher lows, but the range is narrowing.
- Support and resistance lines are both sloping upward.
- The support line (bottom) is steeper than the resistance line (top).
- Typically breaks to the downside.
- Often followed by a significant drop in price after the breakdown.
- Volume usually decreases during formation, then increases on the breakout.
How to Trade the Rising Wedge
- Wait for confirmation: Never assume a wedge will break down. Always wait for the price to close below the lower trendline.
- Watch volume: A surge in volume during the breakdown strengthens the signal.
- Set targets: A common price target is the height of the back of the wedge, subtracted from the breakout point.
- Use stop-loss orders: Place stops just above the upper resistance line in case the pattern fails.
Rising Wedge vs Falling Wedge
While the Rising Wedge is generally bearish, the Falling Wedge is its opposite: a bullish pattern that often precedes upward breakouts. Recognizing the difference between the two helps you stay ahead of the market’s next move.
Final Thoughts
The Rising Wedge may appear subtle, but it often signals a major turning point. Learning to spot this pattern allows traders to protect gains, identify shorting opportunities, and navigate the markets with more confidence.
As always, combine chart patterns with other indicators, such as RSI, MACD, or support/resistance zones, to improve the reliability of your trades. With practice and patience, chart reading becomes a powerful lens for anticipating market direction.
Create a Free Account at WiXy.ai and begin your adventure in the Crypto Space.
Learn more from these articles
A Track Record of Winning.
WiXy.ai delivers. Built on data.
Proven by results. Backtested, battle tested and ready for you.