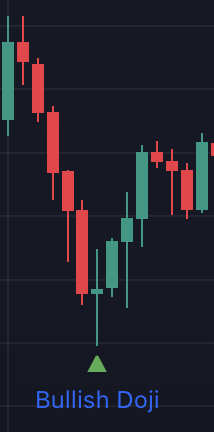
Bullish Doji
Candlestick patterns are essential tools in technical analysis, helping traders interpret price behavior and market sentiment. One of the most intriguing and potentially powerful patterns is the Bullish Doji. Though small in size, this formation can speak volumes—especially when it appears at the right time and place.
- What is a Bullish Doji
- What does it mean
- When is it significant
- How to use it in trading
- Final thoughts
What is a Bullish Doji
A Doji is a candlestick where the opening and closing prices are very close or exactly the same, creating a candle with a very thin or non-existent body. It represents indecision in the market.
A Bullish Doji isn’t just any Doji — it appears after a downtrend, and can signal a potential bullish reversal. It shows that selling pressure may be weakening, and that buyers are starting to gain ground.
What does it mean
During a session where a Bullish Doji forms:
- Sellers may push the price lower.
- Buyers then step in and drive the price back up.
- The candle closes near the open, creating a balance between bulls and bears.
This tug-of-war shows that the downtrend might be running out of steam. While no pattern is 100% certain, a Bullish Doji can be one of the early signs that the market is preparing to shift upward.
Bullish Doji's are used by the WiXy AI algorithm. It is one of the indicators used to determine if WiXy.ai should look for a Bullish signal.
When is it Significant
A Bullish Doji is most meaningful when:
- It forms at the bottom of a clear downtrend.
- It appears near a major support level.
- It's followed by a strong bullish candle, such as a large green (white) body. This confirmation candle is key.
This combination often forms what traders call a Doji Reversal, a classic setup that indicates a change in momentum.
How to Trade it
Traders don’t act on the Doji alone—they usually wait for confirmation. Here’s how it’s often used:
- Entry: After a Bullish Doji, wait for a green candle that closes above the Doji’s high before entering a long trade.
- Stop-loss: Below the low of the Doji candle
- Take profit: Near resistance levels or based on risk/reward ratio.
Additional tools such as RSI (Relative Strength Index), MACD, or volume analysis can strengthen the signal.
Final Thoughts
A Bullish Doji may look small, but its message can be powerful: “The bears are losing control.” For traders who know what to look for, it can be an early sign of a profitable reversal. Combine it with other tools, wait for confirmation, and it can help you spot opportunities before the crowd catches on.
Create a Free Account at WiXy.ai and begin your adventure in the Crypto Space.
Learn more from these articles
A Track Record of Winning.
WiXy.ai delivers. Built on data.
Proven by results. Backtested, battle tested and ready for you.