Inverse Head and Shoulders
In technical analysis, chart patterns often tell a deeper story about market psychology. One of the most reliable and well-known bullish reversal patterns is the Inverse Head and Shoulders. Spotting this pattern early can give traders a significant edge — allowing them to prepare for a potential trend shift before it happens.
- What Is the Inverse Head and Shoulders?
- Structure
- What Does It Tell You?
- How to Trade It
- Why It Matters
- Final Thoughts
What Is the Inverse Head and Shoulders?
The Inverse Head and Shoulders is a chart formation that signals a potential reversal from a downtrend to an uptrend. It’s called “inverse” because it is the upside-down version of the regular Head and Shoulders pattern (which signals a reversal from uptrend to downtrend).
Structure
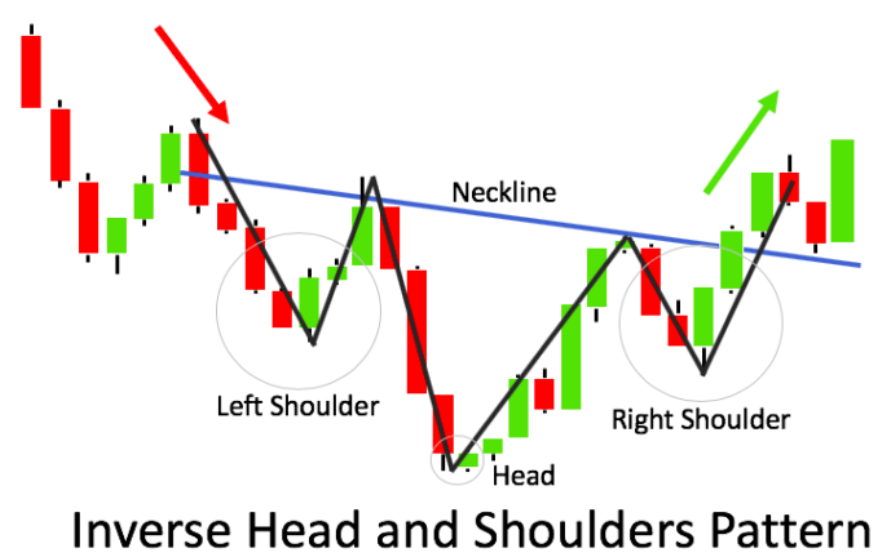
The pattern consists of three main parts:
- Left Shoulder: A price drop followed by a short-term rally.
- Head: A deeper decline, reaching a new low, followed by another bounce.
- Right Shoulder: A smaller drop that stays above the previous low (the “head”), followed by a rally that challenges resistance.
All of these form along a common horizontal or slightly sloping neckline.
Inverse Head and Shoulders are used by the WiXy AI algorithm. It is one of the indicators used to determine if WiXy.ai should look for a Bullish signal.
What Does It Tell You?
This pattern shows that sellers are losing strength. Even though the market pushes to a new low (the head), buyers step in more strongly each time. The higher low at the right shoulder suggests that the downward momentum is weakening. Once the price breaks above the neckline, it often triggers a wave of buying activity — signaling the start of a new uptrend.
How to Trade It
Here’s a common step-by-step approach:
- Identify the full pattern: Make sure both shoulders and the head are clearly visible, and that there’s a definable neckline.
- Wait for the breakout: Only act after the price closes above the neckline with increased volume.
- Measure your target: Measure the distance from the bottom of the head to the neckline. Project that same distance upward from the breakout point for a potential price target.
- Manage your risk: Place a stop-loss just below the right shoulder or below a recent support level to protect against a false breakout.
Why It Matters
The Inverse Head and Shoulders is more than just a pattern — it reflects a shift in sentiment. Sellers try to push prices down multiple times but fail to make lower lows. Buyers grow more confident and eventually regain control.
When spotted in the right context — after a sustained downtrend — this pattern can signal the early stages of a major bullish move.
Final Thoughts
Mastering chart patterns like the Inverse Head and Shoulders helps you understand what the market is really trying to tell you. Don’t rush into trades; instead, observe patiently, confirm with volume or other indicators, and act when the pattern completes. Every pattern you learn strengthens your ability to anticipate opportunities rather than react to them.
Create a Free Account at WiXy.ai and begin your adventure in the Crypto Space.
Learn more from these articles
A Track Record of Winning.
WiXy.ai delivers. Built on data.
Proven by results. Backtested, battle tested and ready for you.